Monday, March 27, 2017

Week 11

Part A: Strain Gauges:
Strain gauges are used to measure the strain or stress levels on the materials. Alternatively, pressure on the strain gauge causes a generated voltage and it can be used as an energy harvester. You will be given either the flapping or tapping type gauge. When you test the circle buzzer type gauge, you will lay it flat on the table and tap on it. If it is the long rectangle one, you will flap the piece to generate voltage.

1. Connect the oscilloscope probes to the strain gauge. Record the peak voltage values (positive and negative) by flipping/tapping the gauge with low and high pressure. Make sure to set the oscilloscope horizontal and vertical scales appropriately so you can read the values. DO NOT USE the measure tool of the oscilloscope. Adjust your oscilloscope so you can read the values from the screen. Fill out Table 1 and provide photos of the oscilloscope.

Table 1: Strain gauge characteristics
Flipping Strength
Minimum Voltage
Maximum Voltage
Low
.6 V pk-pk
1.4 V pk-pk
High
1.32 V pk-pk
3.54V Pk-pk

Table 2: Buzzer gauge characteristics
TappingStrength
Minimum Voltage
Maximum Voltage
Low
2.4 V
2.8 V
High
5 V
6.2 V


Flipping test with high strength Max value 

Flipping test with low strength Max Value

Flipping test with high strength lowest value

Flipping test low strength low value

Tapping test low strength, low value

Tapping test low strength, high value

Tapping test high strength, low value

Tapping test high strength, high value


Part B: Half-Wave Rectifiers

1. Construct the following half-wave rectifier. Measure the input and the output using the oscilloscope and provide a snapshot of the outputs.


Schematic of the Half Wave rectifer


2. Calculate the effective voltage of the input and output and compare the values with the measured ones by completing the following table.

Table 3: Showing the RMS values calculated and measured
RMS Values
Calculated
Measured
Input
3.53 V 
3.6 V 
Output
3.53 V 
2.07 V 

3. Explain how you calculated the rms values. Do calculated and measured values match?

To measure the RMS value you take the appropriate voltage, in this case 10 V. Then you divide it by square root 2.
4. Construct the following circuit and record the output voltage using both DMM and the oscilloscope.
Table 4: Showing the varying output voltages obtained through different measuring mediums with 1uF

Oscilloscope
DMM
Output Voltage (p-p)
5.4 V
1.47 V
Output Voltage (mean)
5.5 V
5.77 V

5. Replace the 1 µF capacitor with 100 µF and repeat the previous step. What has changed?

Table 5: Showing the varying output voltages obtained through different measuring mediums with 100uF

Oscilloscope
DMM
Output Voltage (p-p)
.16 V
.02 V
Output Voltage (mean)
6.83 V
6.75 V

Part C: Energy Harvesters

1. Construct the half-wave rectifier circuit without the resistor but with the 1 µF capacitor. Instead of the function generator, use the strain gauge. Discharge the capacitor every time you start a new measurement. Flip/tap your strain gauge and observe the output voltage. Fill out the table below:

Table 6:
Tap Frequency
Duration
Output Voltages
1 flip/second
10 Seconds
 .26 V
1 flip/second
20 Seconds
 .43 V
1 flip/second
30 Seconds
 .4 V
4 flips/second
10 Seconds
 .44 V
4 flips/second
20 Seconds
 .506 V
4 flips/second
30 Seconds
 .514 V

2. Briefly explain your results.

The longer we flipped the stress the gauge the more the capacitor was being charged. Therefore, the DMM was reading higher values. The same is also true for when we flipped it 4 times a second. The flips generate a voltage, and the capacitor stores the voltage, while simultaneously draining. The more frequent the flips for a longer duration will produce an overall higher voltage.

3. If we do not use the diode in the circuit (i.e. using only strain gauge to charge the capacitor), what would you observe at the output? Why?

The output would be smaller because there isn’t a big rush of electricity flowing through the circuit. The diode we used in the circuit was meant to mimic a half-wave rectifier. We see that when we view our sin waves because there is no negative part this is because of the diode. When the diode is taken out there will have negative values since there is no half-wave rectifier being applied to the circuit.

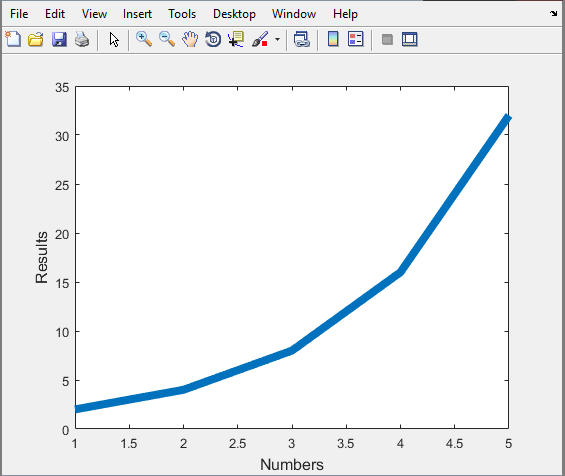
4. Write a MATLAB code to plot the date in table of Part C1.

*Code we used to get the Half-Wave Rectifier Graph*

x=[10 10 20 20 30 30];
y=[.26 .44 .43 .506 .4 .514];
plot(x,y)
xlabel('Time (seconds)');
ylabel('Vout (V)');

grid on

Half-Wave Rectifier Graph


The graph of the half-wave rectifier using MATLAB.


*Code we used to get the Half-Wave Rectifier Graph*

x=[10,20,30];
Va=[0.26,.43,.62];
Vb=[.44,.506,.514];
plot(x,Va,'--k')
hold on
plot(x,Vb)
legend('1 flip/second','4 flip/second')
xlabel('Time (s)')
ylabel('Output Voltage (V)')
title('Half-Wave Recitifier')

Half-Wave Rectifier Graph

This is the graph of both of the Output Voltages, but they are separated.


Monday, March 20, 2017

Blog Week 10

Blog Week 10

1. Open MATLAB. Open the editor and copy paste the following code. Name your code as FirstCode.m
Graph created by the code given in the blogsheet

2. What does clear all do?
~~~~ Clears all predefined variables

3. What does close all do?
~~~~Closes all open windows such as graphs.

4. In the command line, type x and press enter. This is a matrix. How many rows and columns are there in the matrix?
~~~~ 1 row and zero columns

5. Why is there a semicolon at the end of the line of x and y?
~~~~ the semicolon prevents the data from being displayed after "ENTER" is hit.

6. Remove the dot on the y = 2.^x; line and execute the code again. What does the error message mean?
~~~~The dot is needed so that the operation can be applied to each of the values in the matrix

7. How does the LineWidth affect the plot? Explain.
~~~~ It affects the width of line. Smaller integers result in a more narrow line segment.

8. Type help plot on the command line and study the options for plot command. Provide how you would change the line for plot command to obtain the following figure (Hint: Like ‘LineWidth’, there is another property called ‘MarkerSize’)
~~~~plot(x,y,'LineWidth',6,'LineSpec',-or)

9. What happens if you change the line for x to x = [1; 2; 3; 4; 5]; ? Explain.
~~~~ It turns into a single column matrix starting at 1 and ending at 5

10. Provide the code for the following figure. You need to figure out the function for y. Notice there are grids on the plot.

x = [1 2 3 4 5];

y = x.^2;

plot(x, y,':sk', 'LineWidth', 6,'Markersize',20)

xlabel('Numbers', 'FontSize', 12)

ylabel('Results', 'FontSize', 12)
grid on

GridLineStyle ':'

11. Degree vs. radian in MATLAB:
a. Calculate sinus of 30 degrees using a calculator or internet.
Sin(30)= 1/2
b. Type sin(30) in the command line of the MATLAB. Why is this number different? (Hint: MATLAB treats angles as radians).
By default MatLab uses radians

c. How can you modify sin(30) so we get the correct number?
~~Sind(30)

12. Plot y = 10 sin (100 t) using Matlab with two different resolutions on the same plot: 10 points per period and 1000 points per period. The plot needs to show only two periods. Commands you might need to use are linspace, plot, hold on, legend, xlabel, and ylabel. Provide your code and resulting figure. The output figure should look like the following:

t=linspace(0,.125664,10);
y=10*sin(100*t);
plot(t,y,'-or')
hold on
clear t
t=linspace(0,.125664,1000);
y=10*sin(100*t);
plot(t,y,'k')
xlabel('Time (s)')
ylabel('y function')
legend('Coarse','Fine')

13. Explain what is changed in the following plot comparing to the previous one.
~~ The FINE graph has a limit set so that its max value is capped at 5

14. The command find was used to create this code. Study the use of find (help find) and try to replicate the plot above. Provide your code.

t=linspace(0,.125664,10);
y=10*sin(100*t);
plot(t,y,'-or')
hold on
clear t
t=linspace(0,.125664,1000);
y=10*sin(100*t);
k=find(y>5);
y(k)=5;
plot(t,y,'k')
xlabel('Time (s)')
ylabel('y function')


PART B: Filters and MATLAB
1. Build a low pass filter using a resistor and capacitor in which the cut off frequency is 1 kHz. Observe the output signal using the oscilloscope. Collect several data points particularly around the cut off frequency. Provide your data in a table.

~~We need a 7.5k resistor to achieve a cutoff frequency of approximately 1kHz

Table created from the frequency and the associated output in a low pass circuit

2. Plot your data using MATLAB. Make sure to use proper labels for the plot and make your plot line and fonts readable. Provide your code and the plot.
Graph created from the table above. The code used is provided below

****CODE*****
x=[.1 .2 .3 .4 .5 .6 .7 .8 .9 1 2 3];
y=[3.655 3.603 3.525 3.424 3.3 3.177 3.04 2.904 2.767 2.6 1.62 1.07];
plot(x,y)
xlabel('Freqency (KHz)');
ylabel('Vout (V)');
grid on

3. Calculate the cut off frequency using MATLAB. find command will be used. Provide your code.

R=7500; C=22*10^-9;
Cutoff=1/(2*pi*C*R)
----------------------> 964.5754 Hz

4. Put a horizontal dashed line on the previous plot that passes through the cutoff frequency.

Graph with dashed line across the cutoff point. This graph is identical to the graph above


5. Repeat 1-3 by modifying the circuit to a high pass filter.

a)Table for high pass filter

Table created by frequency and the associated output of a  high pass filter circuit


b)Graph for a high pass filter
Graph created from the table above. The code used is provided below

***CODE***
%%
x=[.1 .2 .3 .4 .5 .6 .7 .8 .9 1 1.5 2 2.5 3];
y=[.35 .687 1.007 1.303 1.572 1.811 2.02 2.203 2.361 2.495 2.912 3.063 3.082 3.034];
plot(x,y)
xlabel('Freqency (KHz)');
ylabel('Vout (V)');
grid on

c)Calculate Cutoff of high pass filter

R=7500; C=22*10^-9;
Cutoff=1/(2*pi*C*R)
----------------------> 964.5754 Hz

~~This cutoff is the same for both low pass and high pass filter.

Monday, March 13, 2017

Blog week 9

Blog Week 9

1. Measure the resistance of the speaker. Compare this value with the value you would find online.
~~Our speaker: 9 ohms
~~Online speaker: 6 to 7 ohms (for an 8 ohm speaker)

2. Build the following circuit using a function generator setting the amplitude to 5V (0V offset). What happens when you change the frequency? (video)
Frequency
Observation
1 Khz
Moderate tone (pitch)
3 Khz
Moderate-high tone (pitch)
5 Khz
High tone (pitch)
7 Khz
Higher tone (pitch)
9 Khz
Loud squeal


3. Add one resistor to the circuit in series with the speaker (first 47 Ω, then 820 Ω). Measure the voltage across the speaker. Briefly explain your observations.

Resistor value
Oscilloscope output
Observation
47 Ω
.49 V (Peak to Peak)
.3 V
820 Ω
.992 V (Peak to Peak)
.002 V
~~ The observations that we saw during this segment was that the frequency was constant throughout the segment. The voltage and Peak to Peak values were the only varying measurements. The output of the 47 ohm was barely audible however the output of the 820 ohm speaker was not audible to us, as group members.

4. Build the following circuit. Add a resistor in series to the speaker to have an equivalent resistance of 100 Ω. Note that this circuit is a high pass filter. Set the amplitude of the input signal to 8 V. Change the frequency from low to high to observe the speaker sound. You should not hear anything at the beginning and start hearing the sound after a certain frequency. Use 22 nF for the capacitor.

Picture obtained from Dr. Kaya's blogsheet
a. Explain the operation. (video)
~~
b. Fill out the following table by adding enough (10-15 data points) frequency measurements. Vout is measured with the DMM, thus it will be rms value.

c. Draw Vout/Vin with respect to frequency using Excel.
d. What is the cut off frequency by looking at the plot in b?
    The filter starts attenuating around 9 kHz, which seems to be our cutoff frequency.


Table and a graph of the measurements obtained during the High Pass filter testing. It shows the Vout/Vin (RMS) on the y-axis and the frequency in kHz on the x-axis.


e. Draw Vout/Vin with respect to frequency using MATLAB.


Graph using MatLab where Frequency is in Kilo Hertz and Vout/Vin is in Volts
f. Calculate the cut off frequency theoretically and compare with one that was found in c.
R=100; C=22*10^-9;
LH=1/(2*pi*R*C)~~~~~~~~~~~~~~~~~ 7.2343*10^4 Hz
This differs from the what the cutoff frequency appears to be on our graph (9 kHz), we believe this is because the value calculated is just theoretical, and doesn't have very much merit on our real life circuit. It is odd that it is such a big discrepancy though.

g. Explain how the circuit works as a high pass filter.
~~A high pass filter decreases the ability for low frequency tones to pass through easily and high frequency tones go through much easier.

5. Design the circuit in 4 to act as a low pass filter and show its operation. Where would you put the speaker? Repeat 4a-g using the new designed circuit.
~~The speaker would go in parallel with the resistor and the capacitor.

~a. Explain the operation. (video)

~b. Fill out the following table by adding enough (10-15 data points) frequency measurements. Vout is measured with the DMM, thus it will be rms value.
~c. Draw Vout/Vin with respect to frequency using Excel.

~d. What is the cut off frequency by looking at the plot in b?
~~ Approximately 2KHz
~e. Draw Vout/Vin with respect to frequency using MATLAB. Your code would look like this;

~f. Calculate the cut off frequency theoretically and compare with one that was found in c.
R=100; C=22*10^-9;
LH=1/(2*pi*R*C)~~~~~~~~~~~~~~~~~ 7.2343*10^4 Hz

~g. Explain how the circuit works as a Low pass filter.
~~A low pass filter decreases the ability for high frequency tones to pass through easily and low frequency tones go through much easier.

6. Construct the following circuit and test the speaker with headsets. Connect the amplifier output directly to the headphone jack (without the potentiometer). Load is the headphone jack in the schematic. “Speculate” the operation of the circuit with a video.


Saturday, March 11, 2017

Blog Week 8


Blog Week 8

Schematic drawing of the Rube Goldberg circuit (an explanation of each part of the circuit will be written below in the following pictures)

555 Timer with 1.3M ohms of resistance. The Output of the 555 is sent to the 74192 counter. We can alter the speed at which pulses are created by using more resistance.
The 74192 receives the input from the 555 and converts the pulses that are generated into binary numbers
The binary numbers are sent to the 7447 which converts the numbers from binary to actual numbers. These numbers are displayed on the 7 segment display
The 7 segment display will display the number that is being received. In example, for the above number "5" the 7447 is receiving 0101 from the 74192 which is binary for "5." Which means that it is the 5th pulse received by the 74192. 
I alter the circuit so that when 9 is displayed an LED turns on. This was accomplished by using an AND gate attached to the 7447. The AND gate is looking for two 1's before it was release an output. Using 9 as the goal number we can use the input pins D and A to obtain the goal. I also ran a diode from the AND gate's output to pin 2 of the 555. This prevents the 555 from continuing to count after 9 is obtained.
The AND gate's steady output is sent to a heat sensor and an OP AMP. The OP AMP is required in order to cause the relay to work. The Output of the relay is connect to a DC motor.
The DC motor then spins, and the wire at the end of it acts as a "blade" like as seen in a mixer.

Here is a video of the entire circuit with a commentated explanation 

TWO ISSUES:

The first issue I had in this lab was figuring out a way to make the circuit stop at a given number. I tried a few ideas. doing a little experimenting I noticed that if I ran an input into the comparator pin of the 555 it caused the circuit to stop counting. This gave me the idea to use the output of the AND gate to make it stop at 9. I used a diode to prevent back flow. Without the diode, the circuit just stops counting at whatever number it starts out on.

The second issue I had was a very simple solution. I needed to prolong the circuit long enough to reach the time requirement. I had to play around with the resistance of the 555 timer in order to make the circuit last much longer.